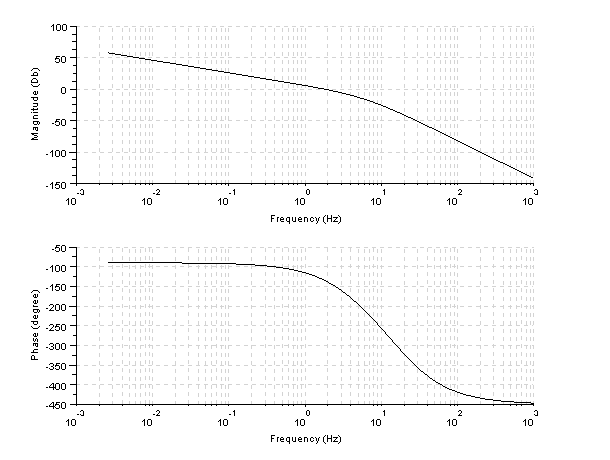
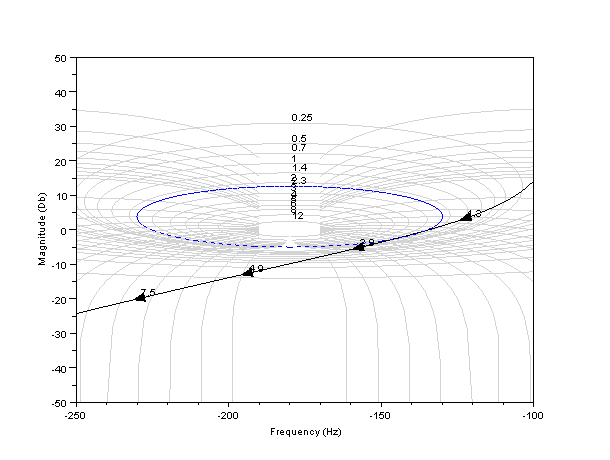
14 Problem A8.18 OGATA 4ed(Nichols chart) Let's draw the Bode plot and the G(jw) locus on Nichols chart by Scilab. Scilab program(Bode plot) clf; s=%s/(%pi*2); g=80*(2-0.1*s)/(s*(s+4)*(s+10)*(2+0.1*s)); gs=syslin('c',g); clf; bode(gs); Scilab program(Nichols chart) clf; s=%s/(%pi*2); g=80*(2-0.1*s)/(s*(s+4)*(s+10)*(2+0.1*s)); gs=syslin('c',g); clf; chart; black(gs); mtlb_axis([-250 -100 -50 50]);
clf;

s=%s/(%pi*2);

g=80*(2-0.1*s)/(s*(s+4)*(s+10)*(2+0.1*s));

gs=syslin('c',g);

clf;

bode(gs);
clf;

s=%s/(%pi*2);

g=80*(2-0.1*s)/(s*(s+4)*(s+10)*(2+0.1*s));

gs=syslin('c',g);

clf;

chart;

black(gs);

mtlb_axis([-250 -100 -50 50]);