13 Problem A8.17 OGATA 4ed(Nyquist plot) Let's draw Nyquist plot for the values of by Scilab Scilab program clf; s=%s/(%pi*2); k=[1 7.5 20] for i=1:3, g(i)=10*k(i)/(s*(s+5)*(0.1*s+1)); gs(i)=syslin('c',g(i)); end; nyquist([gs(1);gs(2);gs(3)] ,['K=1';'K=7.5';'K=20']); mtlb_axis([-5 1 -5 1])
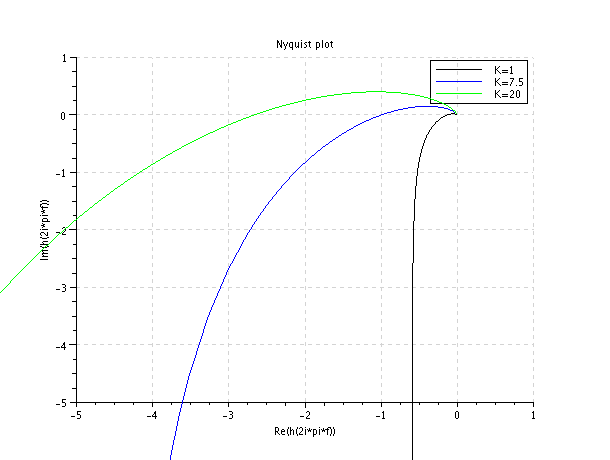
Let's draw Nyquist plot for the values of by Scilab
clf;

s=%s/(%pi*2);

k=[1 7.5 20]

for i=1:3,

g(i)=10*k(i)/(s*(s+5)*(0.1*s+1));

gs(i)=syslin('c',g(i));

end;

nyquist([gs(1);gs(2);gs(3)]
,['K=1';'K=7.5';'K=20']);

mtlb_axis([-5 1 -5 1])