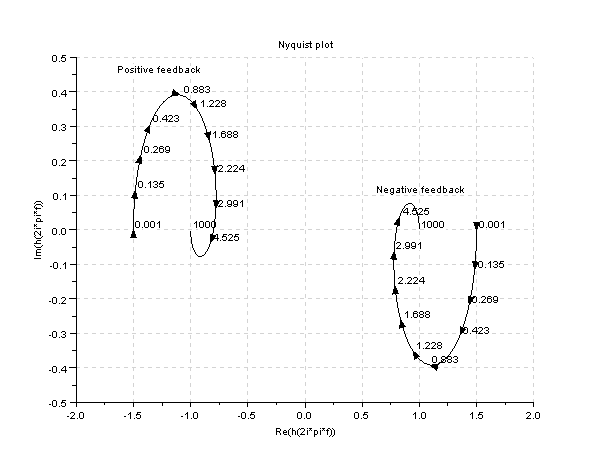
XML
Laplace.T Root-locus Transient response Frecuency response


12 Problem A8.14 OGATA 4ed(Nyquist plot)


    Let's draw the polar plot of positive and negative feedback transfer functions by Scilab

    \begin{displaymath}G(s)=\frac{s^{2}+4\cdot s+6}{s^{2}+5\cdot s+4}\end{displaymath}

    Scilab program
    clf;
    
    s=%s/(%pi*2);
    
    g=-(s^2+4*s+6)/(s^2+5*s+4);
    
    gs=syslin('c',g);
    
    nyquist(gs);
    
    g2=(s^2+4*s+6)/(s^2+5*s+4);
    
    gs2=syslin('c',g2);
    
    nyquist(gs2);
    
    xstring(0.57,0.1,'Negative feedback');
    
    xstring(-1.7,0.45,'Positive feedback');
    
    mtlb_axis([-2 2 -0.5 0.5]);


    Image ProblemaA8-14Pag603