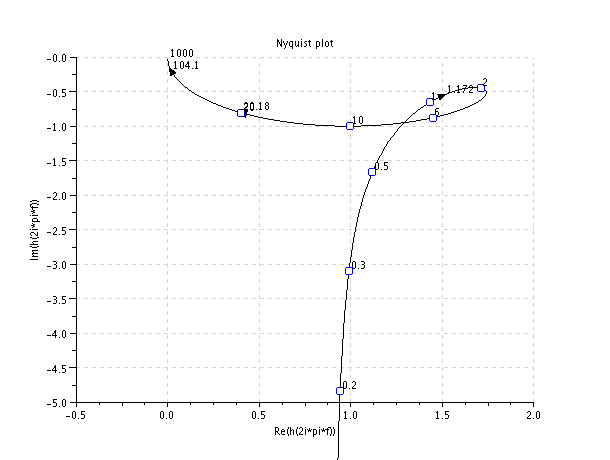
XML
Laplace.T Root-locus Transient response Frecuency response


11 Problem A8.13 OGATA 4ed(Nyquist plot)


    Let's draw on polar plot the points of frequency $w=0.2,0.3,0.5,1,2,6,10,20$ and calculate the phase and gain of these points by Scilab.

    \begin{displaymath}G(s)=\frac{20 \cdot (s^{2}+s+0.5)}{s\cdot(s+1) \cdot(s+10)}\end{displaymath}

    Scilab program
    clf;
    
    s=%s/(%pi*2);
    
    g=20*(s^2+s+0.5)/(s*(s+1)*(s+10));
    
    gs=syslin('c',g);
    
    w=[0.2, 0.3, 0.5, 1, 2, 6, 10, 20];
    
    fr=repfreq(gs,w);
    
    nyquist(gs);
    
    for i=1:8,
    
    x(i)=real(fr(i));
    
    y(i)=imag(fr(i));
    
    t(i)=string(w(i));
    
    plot(x(i),y(i),'o');
    
    xstring(x(i),y(i),t(i));
    
    end;
    
    mtlb_axis([-0.1 2 -5 0]);
    
    [db,phi]=dbphi(fr);
    
    [db;phi]


    Results:
    ans  =
     
        13.835036    10.217883    6.0097561    3.9361863    4.9485002    4.5670563    2.9671948 
     - 0.9799372  
      - 78.95713   - 72.224395  - 55.992508  - 24.145542  - 14.489763  - 31.094569  - 45.028505  
    - 63.438525
    
    Image ProblemaA8-13Pag601