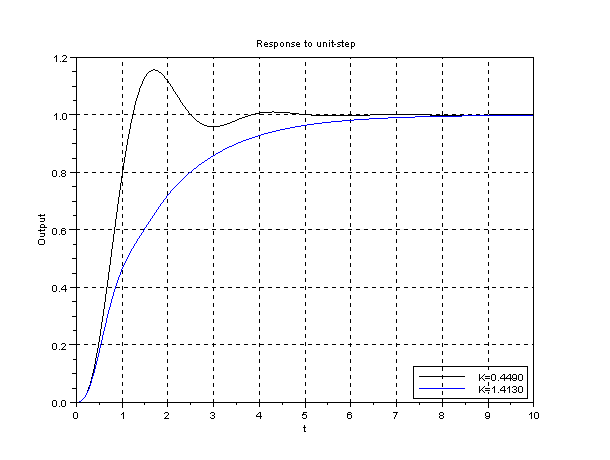
Program in Scilab:
s=%s;
k1=0.4490;
g1=20/(s*(s+1)*(s+4)+20*(1+k1*s));
k2=1.4130;
g2=20/(s*(s+1)*(s+4)+20*(1+k2*s));
t=0:0.1:10;
y1=csim('step',t,g1);
y2=csim('step',t,g2);
clf;
plot(t,y1,'k');
plot(t,y2,'b');
xgrid;
xtitle('Response to unit-step','t','Output');
legend(['K=0.4490';'K=1.4130'],style=4);

|
|