| |
Let us calculate the Laplace transform of the following functions.
-
Solution:
We will decompose the function as follows:
We will use the following transforms
With what we get:
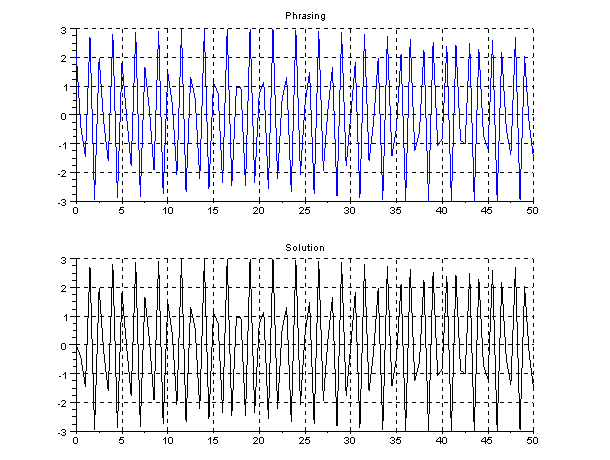
Let's check the result with Scilab..
t=0:0.5:50;
ft=3*sin(5*t+(%pi/4));
s=%s;
fs=3*(5/(s^2+5^2))*cos(%pi/4)+3*(s/(s^2+5^2))*sin(%pi/4);

fs2=syslin('c',fs);
fs1=csim('impulse',t,fs2);
clf;
subplot(2,1,1);
plot2d(t,ft,2);
xtitle('Phrasing');
xgrid;
subplot(2,1,2);
plot2d(t,fs1,1);
xtitle('Solution');
xgrid;
|
|
|
-
Solucion:
We will decompose the function as follows:
We will use the following transforms
With what we get:
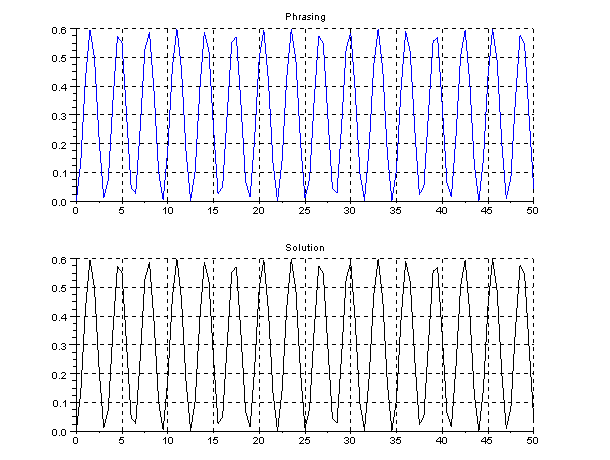
Let's check the result with Scilab..
t=0:0.5:50;
ft=0.3*ones(size(t,2))-0.3*cos(2*t);
s=%s;
fs=0.3*(1/s)-0.3*(s/(s^2+2^2));
fs2=syslin('c',fs);
fs1=csim('impulse',t,fs2);
clf;
subplot(2,1,1);
plot2d(t,ft,2);
xtitle('Phrasing');
xgrid;
subplot(2,1,2);
plot2d(t,fs1,1);
xtitle('Solution');
xgrid;
|
|
|
|