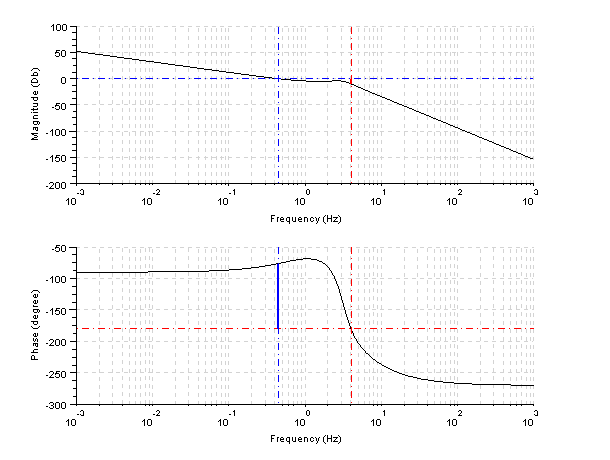
Let's calculate the phase and gain margins. Checks and Bode plot by Scilab
Solution:
Gain Table (dB)
| w |
|
1 |
|
 |
|
5 |
|
 |
(-20) |
0 |
(-20) |
|
(-20) |
|
(-20) |
 |
(0) |
0 |
(20) |
|
(20) |
|
(20) |
 |
(0) |
0 |
(0) |
0 |
(-40) |
|
(-40) |
 |
(0) |
0 |
(0) |
0 |
(0) |
0 |
(-20) |
 |
(-20) |
-7.95 |
(0) |
-7.95 |
(-40) |
-15.91 |
(-60) |
The phase's equation:
Different phase values:
| w |
phase |
| 0.1 |
-98 |
| 1 |
-68.83 |
 |
-139.85 |
| 5 |
-202.61 |
| 10 |
-236.61 |
Gain crossover frequency is in

.
The gain crossover frequency is

. The phase's frequency is:
The phase margin is:

The phase crossover frequency is obtained from this equation:
We obtain

.
We replace the frequency in the following equation:
We obtain a gain margin of 12.08dB
Because the gain and phase margins are positive, the system is stable.
Scilab program
s=%s/(2*%pi);
g=20*(s+1)/((s+0.00000000000001)*(s+5)*(s^2+2*s+10));
gs=syslin('c',g)
[gg,wcp]=g_margin(gs)
[pg,wcg]=p_margin(gs)
clf;
bode(gs);
show_margins(gs);
Results:
-->[gg,wcp]=g_margin(gs)
wcp  =

    4.0130645
 gg  =

    9.9292942

-->[pg,wcg]=p_margin(gs)
 wcg  =

    0.4426366
 pg  =

    103.65727
