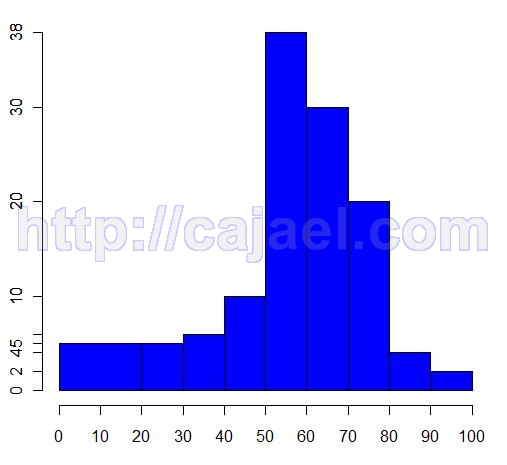
- Statistical simulation of the histogram with R-Project
 x1 <- c(rep(10,5),rep(25,5),rep(35,6),rep(45,10),rep(55,38),rep(65,30)
,rep(75,20),rep(85,4),rep(95,2));

hist(x1, col="blue",breaks=c(0,20,30,40,50,60,70,80,90,100),xaxt = "n"
,yaxt="n",freq=TRUE)

axis(1,c(0,10,20,30,40,50,60,70,80,90,100));

axis(2,c(0,2,4,5,6,10,20,30,38))
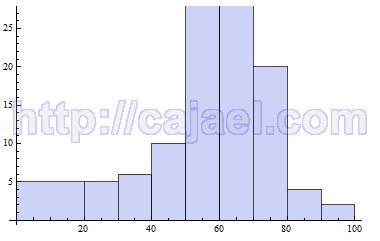
- Statistical simulation of the histogram with Mathematica
x1 := Join[ConstantArray[10, 5], ConstantArray[25, 5],
   ConstantArray[35, 6], ConstantArray[45, 10], ConstantArray[55, 38]
, ConstantArray[65, 30], ConstantArray[75, 20], ConstantArray[85, 4]
, ConstantArray[95, 2]];

Histogram[x1, {{0,20,30,40,50,60,70,80,90,100}}]
|